mandag 14. oktober 2019

BILT EUR 2019: VP in Infrastructure lab materials

I know all your twitter feeds are full of it and you're probably sick and tired of it all, but I'm gonna say it one more time... BILT Europe is a really good conference.
And I've said it before, BILT is one of the best events for actually getting to know people and share good knowledge with each other at the same time. Thank you the the entire committee for everything you do, it's inspiring!
As an example it is not that often that Bad Monkeys Australia gets to meet up with Bad Monkeys Norway :)


So, in that spirit, here is all the materials for my lab this year. Download it and have a look. Some of you will find it easy, others a natural step up. Hopefully, it can provide you with some value.

https://www.dropbox.com/s/ml42lrdm2ndr2t4/Files.zip?dl=0

Sincerely

tirsdag 16. oktober 2018

BILT EUR 2018: Computational Thinking In Infrastructure Projects: Why, What And How

Ok, so as formerly stated, this blog isn't the most updated as of lately. I stay hopeful that it will change at some time in the future. Sonner rather than later. In the mean time feel free to download my handout and files from this years BILT EUR event in Ljubljana.

Handout: https://www.dropbox.com/s/x2po7u2zhnoanh3/S3.2_HANDOUT_V1_jostein%2C%20olsen_Computational%20Thinking%20in%20Infra.pdf?dl=0

Datasets: https://www.dropbox.com/s/0pczr35zpnhap4f/Material.zip?dl=0

Feel free to use whatever! Thanks also to all the people that I met and to all the great sessions at the conference. BILT is fantastic.


onsdag 2. mai 2018

Dynamo and FME: We Need To Go Deeper

FME is a integration plattform for translation of data from a HUGE number of sources. Look at this list of compatible readers and writers: https://www.safe.com/fme/formats-matrix/#!

Safe software which makes FME has recently developed a addin for Dynamo as well, where you can read geometry and data using FME's .NET api.

Quick setup:
1. You must have Dynamo for Revit, version 1.3.2 or newer
2. FME 2018.0 or newer must be installed and licensed.
3. Install the ImportFromFME package from the package manager

The way it works:
1. Navigate to your program files folder and find the FME folder
2. Open this little program:


3. Click on "Create FME Reader Connection" and specify the datasource.
4. Click OK and copy the Connection Parameters string you'll recieve. consider this the recipe for the FME .NET connection you'll do in Dynamo.

5. Fire up Dynamo and specify a log file location and paste the string you copied and use either of the two nodes like this:

Brilliant! :) 


onsdag 1. november 2017

Project Fractal: Brute Force Your Engineering Calculations

Project Fractal has been around for a while now, and I have wanted to test it for what it is worth.
However, the examples I have seen are mostly pointed towards form finding and the architecture side of things, except of course MT Hojgaards excellent example with a parking garage, here: https://www.youtube.com/watch?v=E-3ts053FV0
In focusing only on formfinding and its like I feel we miss out on a lot of great potential uses for this piece of technology.

What I've been thinking of is how we could make a cross border link between the old way of doing things and the new technology that are evolving so rapidly. I want to bring one of those ideas to the table in hope that it can spur others into doing things like it and create more examples that are really useful. We may even help Autodesk in marketing this product, who knows..

Anyways, At our office we have a lot of "old" excel-sheets for doing calculations of random stuff. Yeah, I know.. It's not BIM-ish, but it's the real world. But what if we could take the intrinsic logic of and intellectual capital invested in those Excel sheets and transfer it into some of the newer tools for parametric and generative design and thereby add value to the already invested time in developing these, really quite advanced, Excel-sheets. And one of the case studies was an Excel-sheet for calculating minimum reinforcement anchoring length. Not entirely sure if that is the correct english term, but I think you catch my drift. The only problem for using this in Fractal was that you can't use scripts that open files, so the downside was that I had to transfer the logic of the standards into Dynamo Studio itself.

Now, once this was done I could upload the Script to Web and log in to fractal to run the script as many times as I wanted and then drag the handles in Fractal to see what kind of input parameters mattered the most for the anchoring length. A great way to apply a brute force way of thinking to existing formulas and standards! :)

In Dynamo Studio:


In Fractal:


(And for the really observant reader and avid Euocode user, you may notice I have taken some liberties when it comes to the actual calculations. As in many proof of concepts! ;) )

mandag 9. oktober 2017

BILT EUR 2017: How Dynamo Can Help Revit With It's Topographical Issues

Hi, Everybody! As mentioned in the previous post, a lot of time has been put into preparing for BILT EUR 2017 and the class I had there: How Dynamo Can Help Revit With It's Topographical Issues.

Now, as stated to the participants it is a very narrow subject and in many cases you should probably use other tools (Autodesk even showed a video with improved Civil 3D/Revit exchange, so who knows what the future will bring..)
That said, the stuff I'm bringing to the table here has actually been the last weight to tip the scales in Revit's favor when it comes to choosing BIM-authoring tool at the beginning of a project. Especially for Infrastructure projects, where we possibly couldn't deliver at all with Revit, if we did not have Dynamo.

So, with no further ado:

Handout
Datasets

mandag 28. august 2017

Ammo: Watershed Analysis in Revit, Dynamo, Flux and Grasshopper

It's been a while since my last post for various reasons. The biggest of which is that I'm holding a little session at this years BILT Europe conference about topographies in a Revit/Dynamo environment. In that matter, all spare time goes into preparation for this, so no blogposts then.. It is a quite niche subject, so who knows if anyone shows up for that class at all. Anyway, I will eventually share all the material on this blog as well.
On the matter of topographies, let's have a look at a subject on which I have pondered for a while: How to create a Watershed Analysis (WSA) in Revit.
So what is a WSA you ask.
Well, given a topography/terrain and some start positions for the water, which way will the water go?
Here is a perspective example:
Now going about this, I've tried creating something in Python/Dynamo, but didn't succeed in that endeavour, unfortunately. Let me know if you do! But after some research(that would be googling..) I found a Grasshopper based version with a VB script that proved itself to be adequate for the task. Here is a link to that original forum post.
But how to get my data across? Flux obviously..

Now, I'm not being paid by Flux or anything, but I really love their way of dealing with data exchange. It makes the whole process easy to set up and it is quite fast, especially up to medium-sized data sets. What I transfer back and forth in the example below is a mesh of about 500 faces and a point set of 7500 points.

Here is the script that I set up in Dynamo:
For showing the resulting WSA points in Revit I choose the Point.Analysis nodes as it quite clearly gets the message across. You could also import model curves and what not, but that would be #BadRevit all across the board. For getting a sense of depth, I have extracted the Z-value of each point to be used as an analysis value.

The Grasshopper script looks like this:
The VB-script is included in the files underneath. This particular script uses all the mesh vertices as startpoints for the algorithm

The Dynamo script, once you've run the Grasshopper script, writes an Point Analysis to the view you define and to show it in the Revit view you have to turn on an Analysis Display for that view:
The result in Revit:
And here is a quick example of how fast a change in the input data roundtrips through Flux, Grasshopper and back again as a finished analysis in Revit.

Link to Revit file
Link to Dynamo script
Link to Grasshopper script.


fredag 7. april 2017

Ammo: Excavations with Revit and Dynamo


First of all: Dynamo 1.3 is out! Information found here: http://dynamobim.org/dynamo-1-3-release/

So to the subject of the day: Revit and topographical volumes is no good, right? Well, I can tend to agree on that point..
Sure Revit does calculate net fill/cut etc etc, sure you have possibilities in Site Designer and other addins and sure - you really should use Civil 3D.. Right tool for the right job and so on.
If you however are as me you will need from time to time to accomodate these things in Revit.

A typical workflow we find ourselves in as a structural engineer on small to medium sized projects is that the contractor or our customer wants us to produce an excavation plan something along the lines of this:
Now this is quite often manual labour and we really want to accomodate this in a much better manner.
I've spent some time investegating the possibilities in Dynamo regarding creating solids of these volumes. What we want is a more efficient way to produce the drawings and in addition we want to extract the total volume excavated.

Now why haven't we been able to do this? The reason is sloped excavations. How do we create a solid that are "correct" when presented on a drawing or that calculate the volume we want it? It really has to do with how the internal offsetting of curves are done in Dynamo. You see the offsetting in Dynamo is not that good, unfortunately, but recently I found a little and hidden package called DynamoClipper. See here for a little comparison on how the two methods for offsetting works differently: https://twitter.com/Jos_ols/status/841266065061621760

Now, suddenly, it works the way we expect it to, so here is a little example:

The Revit model (before any scriptrunning)
The script:


Part 1:

Part 2:

Part 3:

Running the script:

And of course, the results:

A solid with correct levels, slopes, corner cuts. All ready to place spot elevations, do dimensions etc.
Not all together finished, but we've gotten a long way.

Packages needed:
- Clockwork
- Springs
- DynamoClipper

Revit test file: https://www.dropbox.com/s/x8j9124irsnh7sq/ExcavationTest.rvt?dl=0

Dynamo script: https://www.dropbox.com/s/vtpvzbepb66nhvd/ExcavationVolume.dyn?dl=0

fredag 6. januar 2017

Ammo: Shortest Path on Topography

I got inspired by three guys this week on Twitter.

First up was Dieter Vermeulen which tweeted this: https://twitter.com/BIM4Struc/status/816283589969068032

Then Zach Kron followed up with this: https://twitter.com/ZachKron/status/817088565570129921

And lastly, but not least, the man responsible for the crucial part in both of the above examples, Mr Nathan Miller over at Proving Ground for bringing over a port to Dynamo from Giulio Piacentino work over at Mcneel and Associates.

And so I will add yet another example to using the Shortest Walk node in the Lunchbox library:

How to get down from a mountain. Fast..


So what I've done is just placing two site components and using them to find the shortest path between them.

The script in its entirety:


As I stated, "Lunchbox" is needed and the almighty "spring nodes" of course.

onsdag 14. desember 2016

Ammo: Centre of Gravity

A challenge arose some days ago as to define a script that could calculate the Centre of Gravity in a Revit model, and of course Dynamo was made for solving these kinds of challenges. Based on the "Algorithm" found here, we applied it to three dimensions in Dynamo. The script uses project base point as Datum and no particular effort has been made to make the units in the calculation usable for anything else. The python script has however been modified to extract density in SI units.

Enjoy! :)


In action:


A version of the script can be found here

torsdag 17. november 2016

Ammo: Sliding Windows - Python tip of the day

Just a quick Python tip of the day.

I regularly find my self in the position of needing to slice lists with "sliding windows"

Like if I have the list {1,2,3,4,5,6,7,8} I would like to return {{1,2},{2,3},{3,4}..etc}

Just found this great way of doing it in dynamo. (I'm sure there are many ways of doing it, but quite simple this one anyways.)


tirsdag 25. oktober 2016

MeshToolkit: Terrain analysis in Dynamo

Just a quick showoff of the new mesh coloring possibilities in MeshToolkit v1.2.

Mind you that there is two different meshtypes in Dynamo and the MeshToolkit doesn't provide a converter between them unfortunately..

But the Springs packages does however! :)


EDIT:

Here's some links to the datasets used above + some extra analysis "tools"

RVT-file: Test_Topography

DYN-file: Mesh Analysis

mandag 24. oktober 2016

The Player: Dynamo for the masses

Revit 2017.1 is out and the best summary you'll find is over at the Revit cat: http://revitcat.blogspot.no/2016/10/whats-new-in-revit-20171.html

The biggest news would be the inclusion of the Dynamo player. This is a brand new tool located right next to the Dynamo icon on the manage pane focused on being a "player" for all your dynamo scripts:


Since the majority of Revit users in any firm is still not very proficient in Dynamo, this means that they can use the scripts that others have created without the hassle of opening dynamo. Awesome!

Comparable to Dyno: http://dyno.arcprojects.ru/  but a cleaner user interface in my opinion: 


Pretty basic. Set script folder, refresh, filter functionality and PLAY! :) You can also edit the scripts by hitting the pen icon and Dynamo will open

But, because there is a but, it only works for scripts with OOTB nodes.The script can't contain any custom packages. On the few test I've done it doesn't seem to work even when the user have these packages installed on their computer, unfortunately.

Still, with a bit of converting and copy/paste you can create scripts with user input as well. The little script below number elements based on a spline running through them. The functionality in the Python scripts below is copied from the Springs and Clockwork packages.

And the results:


fredag 24. juni 2016

Ammo: "Hidden Commands" in Design Script

I'm naturally curious and you kinda have to be to figure your way into the mysterious language of DesignScript. Not so long ago a forum post by Dimitar Venkov sparked my interest as to where to find these commands that are no where to be found. So I asked him, and he guided me to this place in the Dynamo Core. After some tests you can see some of my more useful findings below.


onsdag 22. juni 2016

Star Wars API and Dynamo

It turns out that having a second kid kinda ruin the amount of time one can spend on writing blogs, so here's a short summer-nerd-fest-post from me! :)

Step by step:
1. Luke Johnson posted this: https://twitter.com/lukeyjohnson/status/743343858155610113 
2. Somebody oughta do it..
3. Headed over to this gentleman
4. Voila! Head in to the package manager and search for "Swapi"! :)
(Ps. there is an example script in the extra folder.)

Delight:

turns out R5-D4 is just 1 cm higher than R2-D2. Who would have known..

Have a nice holiday everybody!

mandag 2. mai 2016

Ammo: Point Analysis with Revit and Dynamo

First of all, congratulations to the Dynamo team on the 1.0.0 release. Long awaited, but the work is still in progress according to Zach Kron: http://dynamobim.org/dynamo-1-0-0-release/

The Dev team has also made some changes to the node names. Old definition with the old nodes will be "translated" into the new ones automatically, but it won't update inside code blocks so please be aware of the following changes: https://github.com/DynamoDS/Dynamo/wiki/Dynamo-Node-Changes

Secondly, check out the Prorubim packages right now. I mean right now.. The creator of this collection of packages is Aleksey Lobanov, which some of you already know have created the neat little Dyno addin. In the Prorubim DS Common Kit you'll find the small, but not insignificant GetVar and SetVar nodes which will take any of the standard Dynamo inputs and store it as a kind of a global variable for you to use elsewhere on the canvas. Nice!
Sadly it doesn't work with lists or code block inputs as of yet, but I really think the Dynamo Dev team should implement some of the same logic into "Portal"-nodes. That would be really helpful in this odd spaghetti world we operate in..


Now to the main point of this post. I have to admit one thing..
The analysis nodes in Dynamo located right under the Revit tab has passed right by me up until now. Seen them, thought they were for solar studies, not understood them one bit, moved on.


Thankfully, a cunning fellow over at Autodesk, Dieter Vermeulen, has shown the way in this here blogpost.

It can be used for anything really! If you have data and it is somewhat connected to points, UV's on a surface or maybe even a vector field you can use Dynamo to create a visualisation of that data inside of Revit.
To keep things fairly short I'll focus on the PointAnalysis in this post, the others (Vector and Face) works in a near identical manner so I'll guess you can figure it out.

Proof of concept: Height map on topography
Just a simple little test for showing the capabilities. Takes a topo, creates a point grid and project it on the surface. Measures the distance to topo and send the data to Revit.

A little proof of concept script
(Ps, the Unit Type node seems to be flawed in 1.0.0, have reported it..)
Once you've run the definition once the PointAnalysis node has sent the data to a view in Revit, but you will have to conjure the data up by doing a little view settings exercise.

1. Select the Default Analysis Display Style
2. Hit the new Display style icon
3. Choose your analysis style
Now figure out your settings with colors, sizes etc. and you're all set.

Few other examples of use:

Stadion C-values:

Where the best place is to be at the AU 2016 opening keynote according to my last post and visualised in Revit:


As I said, endless possibilities! :)


tirsdag 5. april 2016

Dynamo and Optimo: Optimizing your Carl Bass Keynote Experience

For a long time now, I've have felt an urge to explore the capabilities of the Optimo package in Dynamo. However it has seemed like such a montainous task that I've constantly postponed my interest. Easter break however, provided a window for dwelving into these things.

I've experienced that the best way to learn anything in the world of Dynamo is to have a problem that you can experiment on. As I'll have to be somewhat careful with examples from my daily job, I figured why not make it an abstract one.

So to get you in the mood, picture yourself at AU 2016. Tech nerds are swarming and Carl Bass (CB) is about to hold his opening keynote. This year however, there are no seats provided in the room and the room acoustics are horrendous. To accomodate this awful planning mistake, Autodesk has put up a number of bars serving the finest beers available.
(An appreciation party and opening keynote all at once make for one heck of a opening, right?)
Lazy as you are you want to be as close to the bar as possible while also be as close as possible to CB. Additionally you want to hear CB as good as you can as he speaks about coming trends and whatnot.

Or somewhat redefined: Given CB's position, the position of the bars and an acoustic map of the venue, which X,Y gives me the shortest distance to both beer and Mr. Bass, while also having the best acoustics?
Where to stand? (PS. stick figure not drawn with dynamo.)

My acoustic map. More black=Better Acoustics

Although the example is "dumb" it provides an interesting enough example case for taking Optimo for a run. Consider the post a Layperson's guide to the galaxy of optimization.

If you want to learn the indepths of Optimo I suggest going over to their website
here: http://bim-sim.org/Optimo/

Some optimization terms explained first: 
Simply put, the genetic optimization in the Optimo package tries to mimick Darwin's theory of evolution.
You make a 1. generation population, decides what is desirable "genes" and Optimo iterates through the "generations" to help you find the optimal solutions to your problem. The spesific algorithm used in Optimo is called NSGA-II
(If you want the whole shebang go to Wikipedia:https://en.wikipedia.org/wiki/Multi-objective_optimization)

Populationlist:
This is just how many initial values we would like to evaluate.
In our example that would be how many different values of X and Y would we like to evaluate in our script. A larger population can have some effect on our outcome in terms of accuracy, but more importantly it drives the the main datastructure of the script, so:
Larger population=More datapoints=More readable graph.

Objective:The objectives in our example is to minimize:
  1. The distance from the given X,Y-values to the closest bar
  2. The distance from the given X,Y-values to CB
  3. The amount of white at the given X,Y according to the acoustic map. (Black is better.)

Fitness function:
First of all the term "Fitness" can be anything. It's just a measurement. All Optimo tries to do is to minimize the fitnessvalue for all objectives. This means that we have to design the fitness function so they report fitness in the way Optimo likes it.
If you want to maximize something, you would have to multiply that something with -1 so that the fitness reports lower values for better solutions. If you want the resulting fitness values to be in a comperable range consider introducing some factors to even the fitness functions out between each other (Like multiplying with 10, dividing by 1000 etc..)
In our example two of our fitness functions returns a distance in meters and the lower the distance the fitter the X,Y-value are. The third one obtains a brightness value from an acoustic map based on the given X,Y and the blacker the spot is the lower the fitnessvalue (aka "more fit")

Pareto-front:
This is our results. A Pareto front is the resulting graph of fitness values that indicates the solutions for the problem at hand where none of the fitness function results can be better without others becoming worse. Read about it here: https://en.wikipedia.org/wiki/Pareto_efficiency 
In our example we will obtain a 3d scatter plot because we have 3 objectives with varying fitness values. the value that is closest to 0 will be the most optimum value if you weigh all the fitness results the same.

The Main script:
The script below shows the basic layout for any script using Optimo. I'll try my best to explain each node to demystify the Optimo package. (It isn't as hard as it looks..) Please notify the organization of variables and fitness functions in lists as this is how the Optimo nodes works.

  • NSGA_II.InitialSolutionList:
    Sounds complicated, but isn't. Creates a number(PopulationSize) of random values between lower and upper limits for our position's X and Y respectively and adds x placeholder lists for our fitness functions. In our example it creates 5 sublists,
    [0] and [1] for random values of X and Y respectively.
    [2],[3],[4] containing just 0's for later to be overwritten with our fitness results.

  • Fitness functions:
    In this script we have 3 objectives, and each of the objectives has its own fitness function. All they do is some simple stuff to calculate the different fitness values,
Bar Fitness
Carl Bass Distance Fitness
Carl Bass Audio Fitness
  • NSGA_II.AssignFitnessFuncResults
    This is just a custom node from the Optimo package to assign our initial fitness results to the initial population list so that the resulting list contain both our X,Y-values as well as the fitness values.
  • NSGA Function
    This is where the magic happens and I'm not gonna go into this in detail. Shortly put it mimicks our main graph, except it has node which sorts the fitness result for each generation and add some randomness as to "mutate" into better fitness results.
  • Loop Completion Check
    This node acts as a counter and returns a boolean value which tells the loop node when to stop. The number you give as a input here equals the number of generations you will iterate through.
    Higher number=More generations=More precise results.
Pressing run begins the iteration and once we have some results we can start to interpret them.


You can observe two things from the above:
1. The resulting Pareto front. As you can see the distance from bars and CB are rather linear on the Pareto front, and the fitness values based on the acoustic map (Z-value) fluctuates a bit more, as one could expect. The closest point to zero is marked by a line.
2. The most optimal point to stand if you value all the objectives equally. (Marked red in gif)
As you can see, the point made by the three fitness values at index 12 is the point closest to 0,0 and we can then extract the X,Y values at index 12 from our population list.

Sooo, where to stand?.. Here:

Now, the Pareto front can look very different depending on the problem, and if I understood it correctly it's practically an entire science just interpreting them, but for many problems in the AEC-industry it should be quite readable. Searching for optimalization online will get you many hits based in Academia, but hopefully we'll see this on more practical cases in the future as it has awesome potential!

Ps. Datasets will not be provided as of yet since you'll learn much more by doing it your self. (That's at least my opinion.) Reach out if you're in dire need! :)

søndag 13. mars 2016

Ammo: Creating Isovists in Revit


I've been inspired lately by raytracing and what you can use it for in an Revit/Dynamo environment. The inspiration came from Twitter and the wonderful expertise the people I follow possess. It started with Dieter Vermeulens tweet and blogpost here. From there I tested a quick example by using some of the same logic in a topography environment in Revit, ended up looking like this:

(Just to let you know, the raytracing functionality in revit can't do topos, but it can use family instances generated with spring nodes. Hint hint..)

Anyway, I shared the above pic on Twitter and it got retweeted by, among others, "some guy" called Amar Hanspal. I may have to study the Autodesk Organization Chart a little better, because it was Dieter who had to point out that it was Autodesk' very own Product SVP . Holy cow.. Thanks!

Now another helpful guy called Dimitar Venkov, pointed me in direction of another wise gentleman called Kean Walmsley and his blogpost here.
Reading this post I got to know what isovists are, and naturally wanted to explore this a bit more. 

From Wikipedia: "A single isovist is the volume of space visible from a given point in space, together with a specification of the location of that point."

and a more graphical explanation of a 2d isovist because we are so visually oriented..

Dieter confided to rooms and I thought why not go outside that window and into the cityscape? In a preliminary design phase it would be nice to have some sort of analysis of what you actually see from the 73th floor balcony in your building wouldn't it?

So how do we get about this then? Well, the guys behind the acoustamo package have pointed out that the raytracing in Revit is a bottleneck. But I think it has worked pretty well so far. Another simplification I've made is that I have enclosed the entire test area with a circular wall that I've hidden in all but one view
to complete the isovist inside those walls. Could have been handled by importing all the geometry to Dynamo and creating some sort of enclosing geometry there, but I think it will suffice for all intents and purposes.

Overview:

Raytracing and filtering:
(There are many way to produce the vectors which are fed into the RayBounce node, but i used spherical coordinates as it is applicable to 3d isovists as well.)

Line based result options:

Polycurve/patch based result options:

As this is more of a proof of concept I've included some different result presentations as examples. Let's hope some real architects come up with something better. (They're probably using grasshopper/rhino anyways, but still..)

Results from the various parts:

Regular detaillines:


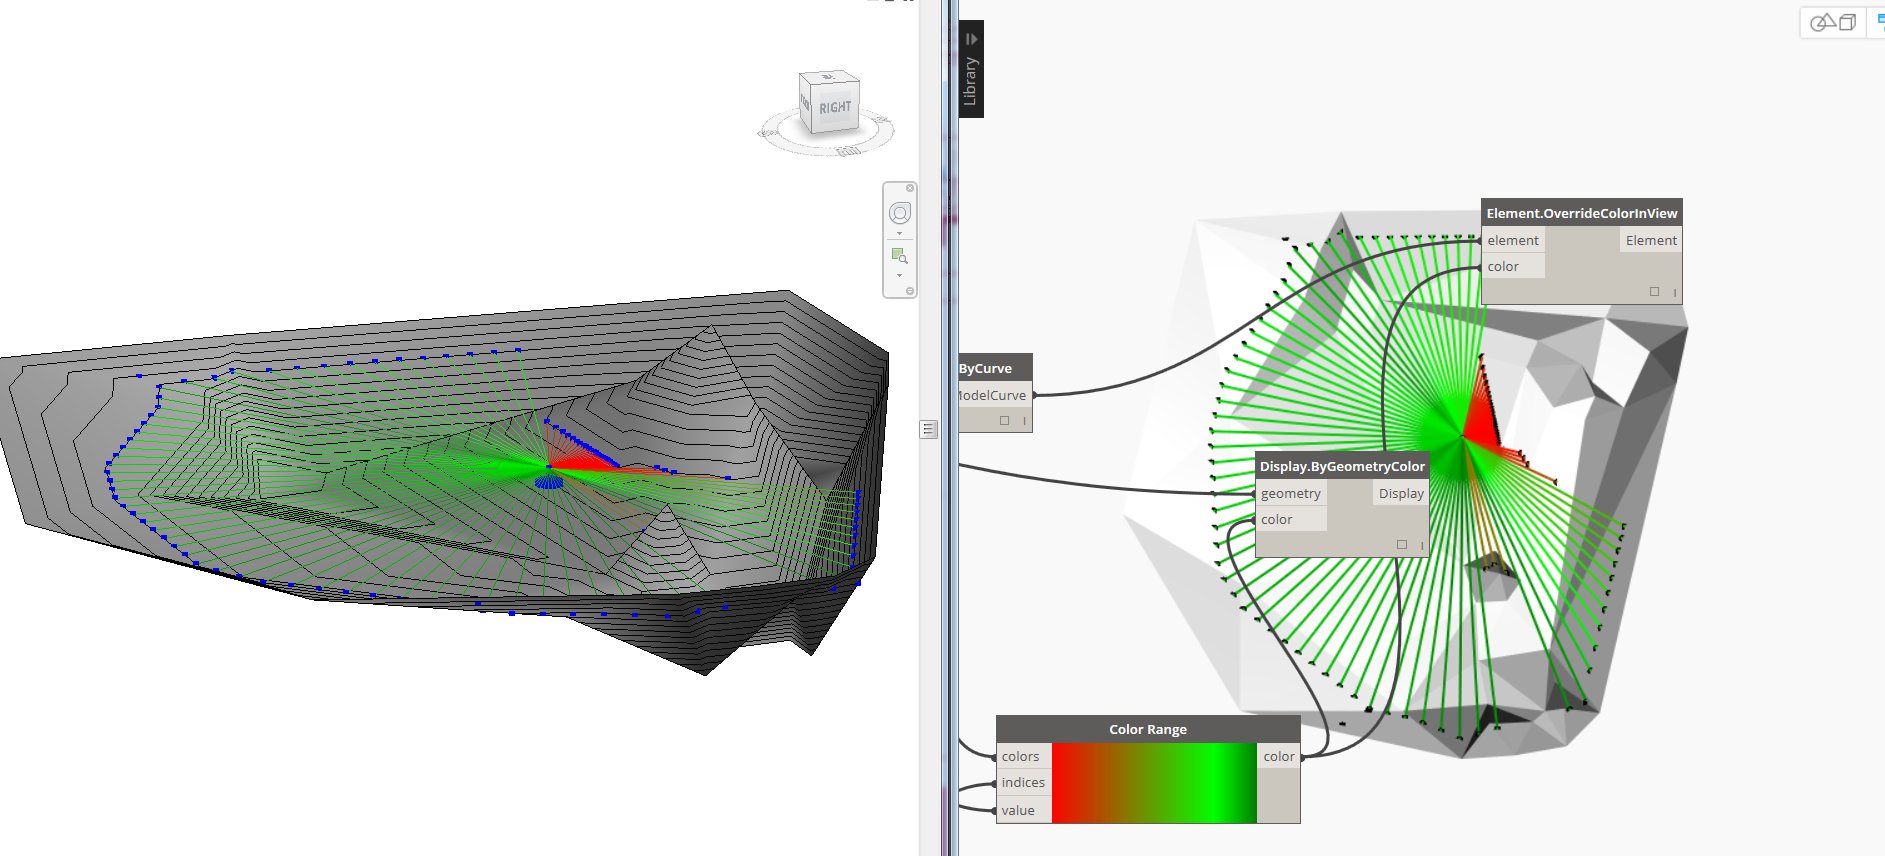
Model curves overridden by color by lengths:
Visualisation in dynamo:


Model curves by perimeter:

Detail region created from the above model curves:


Direct shape by perimeter:


Now, there are many things you can use this for and the pics above are but a few examples. Still, the power of Dynamo is that it makes us able to create tools where WE can decide what the outcome will be by ourselves. 

Now if I only can figure out a way to create a 3d Isovist solid..